一般社団法人日本音楽著作権協会 JASRACのサイトで2014年度の使用料徴収額が公開されましたので、カテゴリ別、項目別の使用料徴収額の推移などをまとめてみました。
※各使用料徴収額は以下の資料より参照
平成12年度使用料等徴収額。平成13年度使用料等徴収額。平成14年度使用料等徴収額。平成15年度 使用料等徴収額。2004年度使用料等徴収額。2005年度使用料等徴収額。2007年定例記者会見資料(PDF)。2008年定例記者会見資料(PDF)。2009年度定例記者会見資料(PDF)。2010年度定例記者会見資料(PDF)。2011年度定例記者会見資料(PDF)。2012年定例記者会見資料(PDF)。2013年定例記者会見資料(PDF)。2014年定例記者会見資料(PDF)。2015年定例記者会見資料(PDF)。
※各数字は後に訂正される可能性があります。
2014年度の種目別使用料徴収額
2014年度の種目別の使用料徴収額を徴収額の多い順に並び替えたものです。
|
種目 |
徴収額 |
前年度比 |
構成比 |
| 1 |
放送等 |
316億1526万1530円 |
106.2% |
28.10% |
| 2 |
演奏等 |
205億5172万5730円 |
103.1% |
18.27% |
| 3 |
ビデオグラム |
181億3048万224円 |
93.5% |
16.12% |
| 4 |
オーディオディスク |
130億8535万7712円 |
92.5% |
11.63% |
| 5 |
インタラクティブ配信 |
88億6225万4890円 |
101.6% |
7.88% |
| 6 |
通信カラオケ |
67億9915万6220円 |
105.1% |
6.04% |
| 7 |
有線放送等 |
57億6058万2213円 |
127.6% |
5.12% |
| 8 |
貸与 |
34億3221万9520円 |
98.5% |
3.05% |
| 9 |
録音・その他 |
17億8001万5413円 |
91.9% |
1.58% |
| 10 |
出版 |
11億4830万511円 |
104.8% |
1.02% |
| 11 |
BGM |
4億9626万1254円 |
114.2% |
0.44% |
| 12 |
外国入金演奏 |
4億7354万8222円 |
89.9% |
0.42% |
| 13 |
外国入金録音 |
1億9052万8708円 |
90.9% |
0.17% |
| 14 |
映画上映 |
1億6903万7789円 |
117.1% |
0.15% |
| 15 |
私的録画補償金 |
10万3244円 |
0.90% |
0.00% |
| 16 |
私的録音補償金 |
156円 |
0.00% |
0.00% |
|
使用料徴収額合計 |
1124億9483万3336円 |
101.5% |
100.00% |
カテゴリと種目別の使用料徴収額の推移
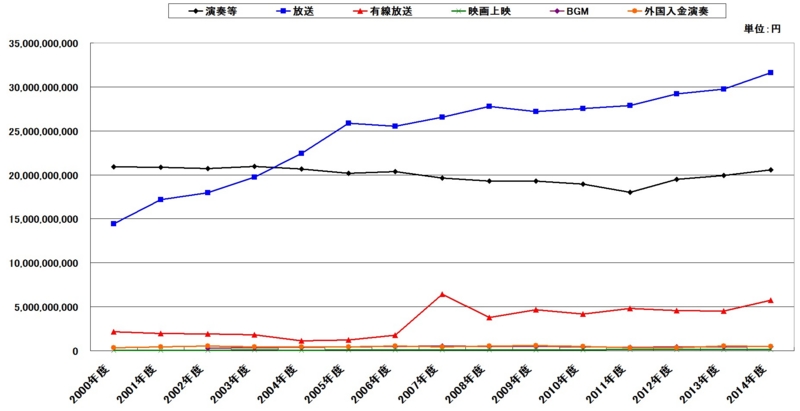
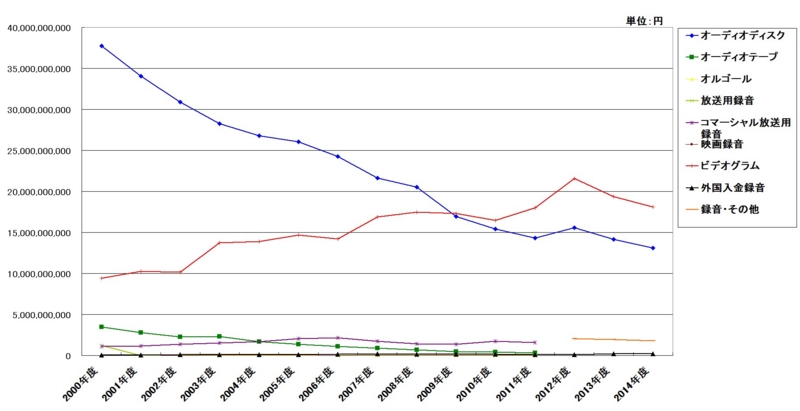
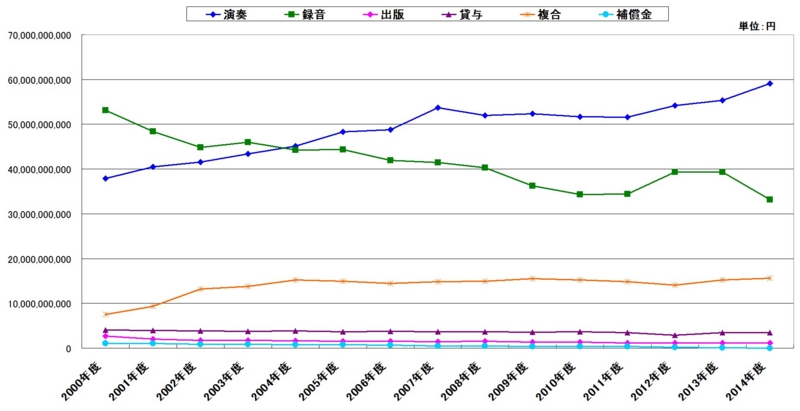
使用料徴収額の大きなカテゴリである「演奏」、「録音」、「出版」、「貸与」、「複合」、「補償金」及び、その種目ごとの徴収額の推移です。
演奏
|
演奏等 |
放送 |
有線放送 |
映画上映 |
BGM |
外国入金演奏 |
| 2000年度 |
209億194万3901円 |
144億2883万107円 |
21億3807万385円 |
6366万6203円 |
* |
3億3174万8129円 |
| 2001年度 |
208億6647万4722円 |
171億8563万4483円 |
19億5098万0434円 |
5620万9356円 |
* |
4億3214万5741円 |
| 2002年度 |
207億2598万8948円 |
179億7393万6337円 |
19億3618万7147円 |
5491万3320円 |
2億8676万3219円 |
5億3871万8709円 |
| 2003年度 |
209億6714万6970円 |
197億2943万3505円 |
18億2846万6417円 |
9067万1992円 |
3億2622万7725円 |
4億4106万3537円 |
| 2004年度 |
206億8990万1941円 |
224億1862万5886円 |
11億1652万0018円 |
6722万2929円 |
3億9285万1492円 |
4億3711万6256円 |
| 2005年度 |
201億9826万7833円 |
258億8583万6019円 |
12億4614万4202円 |
9960万9195円 |
4億6381万0614円 |
4億5778万7313円 |
| 2006年度 |
203億4896万6730円 |
255億1566万6935円 |
17億7566万8063円 |
1億300万6442円 |
5億231万7829円 |
5億2971万0870円 |
| 2007年度 |
196億4797万4058円 |
265億5914万8080円 |
64億4830万8222円 |
8808万885円 |
5億2010万6861円 |
4億3965万3130円 |
| 2008年度 |
193億0778万8362円 |
277億6749万8574円 |
37億7992万4659円 |
8928万9529円 |
5億1172万4295円 |
5億4749万1251円 |
| 2009年度 |
193億1224万1056円 |
271億7860万8661円 |
46億6488万2636円 |
9696万2519円 |
4億6931万7904円 |
6億613万9495円 |
| 2010年度 |
189億7119万7649円 |
275億4320万3947円 |
41億5498万7851円 |
1億709万1701円 |
4億6381万1781円 |
4億6710万5567円 |
| 2011年度 |
180億0972万4164円 |
278億8606万2827円 |
47億8894万7821円 |
1億4959万20円 |
4億1653万9147円 |
3億6108万9228円 |
| 2012年度 |
195億0288万8905円 |
292億1960万1661円 |
45億7349万7335円 |
1億5123万98円 |
4億2308万9650円 |
3億2731万8217円 |
| 2013年度 |
199億3933万9832円 |
297億6287万259円 |
45億1513万2703円 |
1億4438万5663円 |
4億3448万9513円 |
5億2667万6112円 |
| 2014年度 |
205億5172万5730円 |
316億1526万1530円 |
57億6058万2213円 |
1億6903万7789円 |
4億9626万1254円 |
4億7354万8222円 |
|
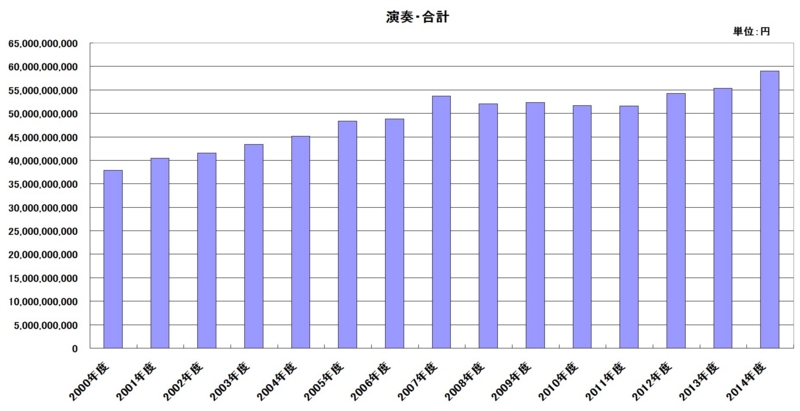
演奏・合計 |
| 2000年度 |
378億6425万8725円 |
| 2001年度 |
404億9144万4736円 |
| 2002年度 |
415億1650万7680円 |
| 2003年度 |
433億8301万146円 |
| 2004年度 |
451億2223万8522円 |
| 2005年度 |
483億5145万5176円 |
| 2006年度 |
487億7533万6869円 |
| 2007年度 |
537億0327万1236円 |
| 2008年度 |
520億0371万6670円 |
| 2009年度 |
523億2815万2271円 |
| 2010年度 |
517億0739万8496円 |
| 2011年度 |
516億1195万3207円 |
| 2012年度 |
541億9762万5866円 |
| 2013年度 |
553億2289万4082円 |
| 2014年度 |
590億6641万6738円 |
録音
|
オーディオディスク |
ビデオグラム |
外国入金録音 |
録音・その他 |
| 2000年度 |
377億4972万3915円 |
94億4237万1625円 |
4906万6971円 |
* |
| 2001年度 |
340億5876万5559円 |
102億6653万5816円 |
3234万4546円 |
* |
| 2002年度 |
308億7374万3646円 |
101億3273万6314円 |
1億2948万0932円 |
* |
| 2003年度 |
282億7625万2931円 |
137億1586万7633円 |
1億1377万2098円 |
* |
| 2004年度 |
267億7384万4335円 |
139億1814万8095円 |
1億0984万2932円 |
* |
| 2005年度 |
260億4598万9055円 |
146億9841万7082円 |
1億1255万2755円 |
* |
| 2006年度 |
242億5205万0738円 |
142億2285万5307円 |
1億4966万5106円 |
* |
| 2007年度 |
216億4597万7036円 |
169億1819万8500円 |
2億628万1280円 |
* |
| 2008年度 |
205億1351万3985円 |
174億8166万6141円 |
1億7544万2174円 |
* |
| 2009年度 |
169億3895万6150円 |
173億1635万6633円 |
1億3301万3435円 |
* |
| 2010年度 |
154億4713万2897円 |
164億9283万1103円 |
1億4111万6081円 |
* |
| 2011年度 |
143億493万4335円 |
180億0068万2708円 |
1億2444万5489円 |
* |
| 2012年度 |
155億5375万4781円 |
215億8089万1856円 |
1億3054万9206円 |
20億6938万0641円 |
| 2013年度 |
141億5254万6909円 |
193億8261万3671円 |
2億0970万5908円 |
19億3759万1606円 |
| 2014年度 |
130億8535万7712円 |
181億3048万224円 |
1億9052万8708円 |
17億8001万5413円 |
※2011年度まであった種目
|
オーディオテープ |
オルゴール |
放送用録音 |
コマーシャル放送用録音 |
映画録音 |
| 2000年度 |
34億5018万4284円 |
6826万195円 |
12億2966万4194円 |
10億8568万1791円 |
2819万1517円 |
| 2001年度 |
28億264万8474円 |
5357万4375円 |
2486万4720円 |
11億4836万8210円 |
3488万1472円 |
| 2002年度 |
22億6126万950円 |
3058万9426円 |
1072万7126円 |
13億5656万2359円 |
2578万8163円 |
| 2003年度 |
22億9714万2826円 |
2170万4936円 |
13万0935円 |
15億744万1713円 |
3375万6666円 |
| 2004年度 |
16億8324万8340円 |
1960万1632円 |
* |
16億7540万1570円 |
5017万7579円 |
| 2005年度 |
13億5638万2581円 |
1520万1984円 |
* |
20億6004万4286円 |
3718万9311円 |
| 2006年度 |
11億1952万6908円 |
1495万0362円 |
23万1728円 |
21億4645万2371円 |
2529万6427円 |
| 2007年度 |
8億8414万2757円 |
1612万8594円 |
1680円 |
17億4751万5172円 |
4366万0287円 |
| 2008年度 |
6億8878万3801円 |
1476万1448円 |
7558円 |
14億923万6218円 |
3959万2028円 |
| 2009年度 |
4億9399万1924円 |
1478万7007円 |
840円 |
13億6133万8560円 |
2700万1339円 |
| 2010年度 |
4億2509万8079円 |
1531万9858円 |
2100円 |
17億3512万7931円 |
3857万2657円 |
| 2011年度 |
3億3288万4933円 |
1183万619円 |
1679円 |
15億8118万274円 |
3558万3820円 |
|
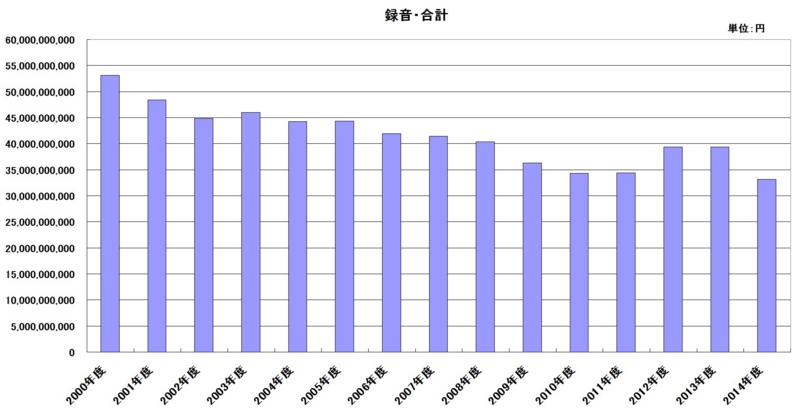
録音・合計 |
| 2000年度 |
531億314万4492円 |
| 2001年度 |
484億2198万3172円 |
| 2002年度 |
448億2088万8916円 |
| 2003年度 |
459億6606万9738円 |
| 2004年度 |
442億3026万4483円 |
| 2005年度 |
443億2577万7054円 |
| 2006年度 |
419億3102万8947円 |
| 2007年度 |
414億6190万5306円 |
| 2008年度 |
403億2300万3353円 |
| 2009年度 |
362億8544万5888円 |
| 2010年度 |
342億9520万706円 |
| 2011年度 |
343億9154万3857円 |
| 2012年度 |
393億3457万6484円 |
| 2013年度 |
393億3457万6484円 |
| 2014年度 |
331億8638万2057円 |
出版
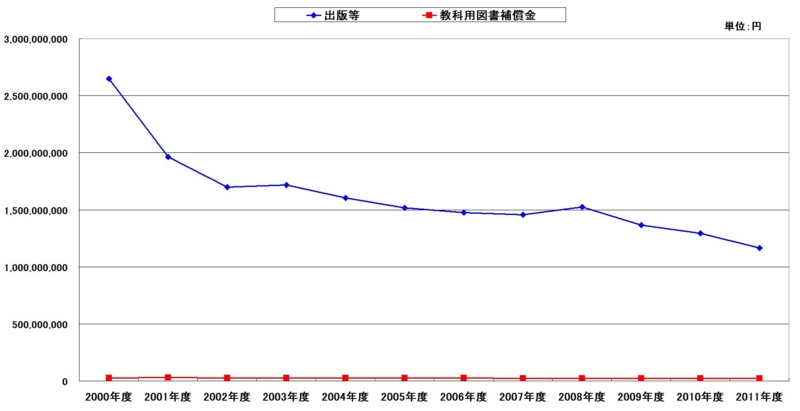
※2012年度から出版等、と教科用図書補償金の種目は無くなり、おそらく合算された「出版」のみの数字になります。
|
出版・合計 |
| 2000年度 |
26億7538万54円 |
| 2001年度 |
19億9276万4147円 |
| 2002年度 |
17億2567万3207円 |
| 2003年度 |
17億4311万4516円 |
| 2004年度 |
16億2729万5695円 |
| 2005年度 |
15億4350万9004円 |
| 2006年度 |
15億0042万8137円 |
| 2007年度 |
14億7917万7296円 |
| 2008年度 |
15億4850万7692円 |
| 2009年度 |
13億8822万3596円 |
| 2010年度 |
13億1668万2649円 |
| 2011年度 |
11億8942万3588円 |
| 2012年度 |
11億6307万5757円 |
| 2013年度 |
11億6307万5757円 |
| 2014年度 |
11億4830万511円 |

※2011年度まであった種目
|
出版等 |
教科用図書補償金 |
| 2000年度 |
26億4751万2568円 |
2786万7486円 |
| 2001年度 |
19億6431万9622円 |
2844万4525円 |
| 2002年度 |
16億9748万2643円 |
2819万564円 |
| 2003年度 |
17億1568万7696円 |
2742万6820円 |
| 2004年度 |
16億259万6386円 |
2469万9309円 |
| 2005年度 |
15億1890万8662円 |
2460万342円 |
| 2006年度 |
14億7387万8233円 |
2654万9904円 |
| 2007年度 |
14億5541万9565円 |
2375万7731円 |
| 2008年度 |
15億2424万9076円 |
2425万8616円 |
| 2009年度 |
13億6381万8154円 |
2440万5442円 |
| 2010年度 |
12億9235万8683円 |
2432万3966円 |
| 2011年度 |
11億6546万2956円 |
2396万632円 |
貸与
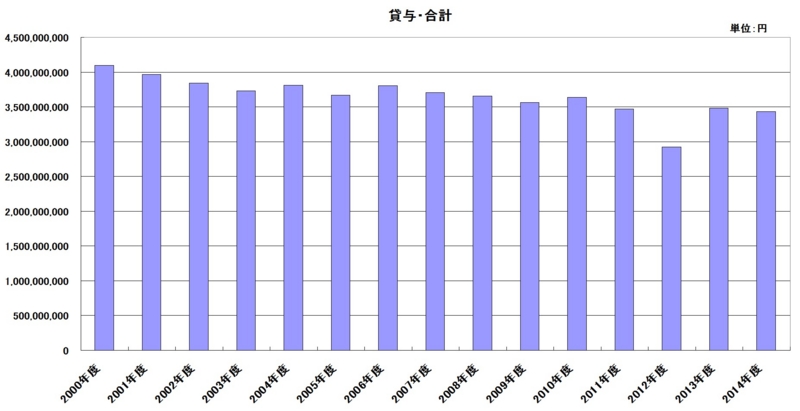
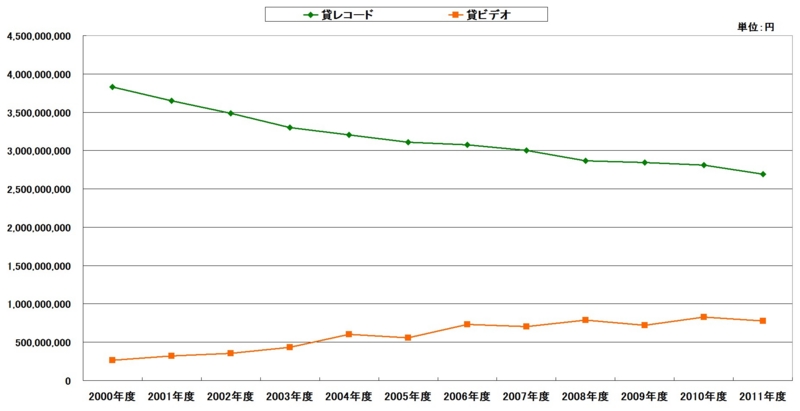
※2012年度から「貸レコード」と「貸ビデオ」の種目が無くなり、おそらく合算された「貸与」のみの数字になります。
|
貸与・合計 |
| 2000年度 |
40億9356万9877円 |
| 2001年度 |
39億6777万6630円 |
| 2002年度 |
38億3921万76円 |
| 2003年度 |
37億3269万1889円 |
| 2004年度 |
38億0987万7196円 |
| 2005年度 |
36億6728万4139円 |
| 2006年度 |
38億0613万8257円 |
| 2007年度 |
37億0485万2382円 |
| 2008年度 |
36億5304万3876円 |
| 2009年度 |
35億6393万6962円 |
| 2010年度 |
36億3581万293円 |
| 2011年度 |
34億6905万5599円 |
| 2012年度 |
29億2611万6082円 |
| 2013年度 |
34億8397万3355円 |
| 2014年度 |
34億3221万9520円 |
※2011年度まであった種目
|
貸レコード |
貸ビデオ |
| 2000年度 |
38億3057万5916円 |
2億6299万3961円 |
| 2001年度 |
36億4861万846円 |
3億1916万5784円 |
| 2002年度 |
34億8404万0336円 |
3億5516万9740円 |
| 2003年度 |
32億9771万9324円 |
4億3497万2565円 |
| 2004年度 |
32億0597万4544円 |
6億0390万2652円 |
| 2005年度 |
31億0962万8496円 |
5億5765万5643円 |
| 2006年度 |
30億7420万9989円 |
7億3192万8268円 |
| 2007年度 |
30億0092万5828円 |
7億0392万6554円 |
| 2008年度 |
28億6390万7418円 |
7億8913万6458円 |
| 2009年度 |
28億4240万5297円 |
7億2153万1665円 |
| 2010年度 |
28億951万9774円 |
8億2629万519円 |
| 2011年度 |
26億9315万7255円 |
7億7589万8344円 |
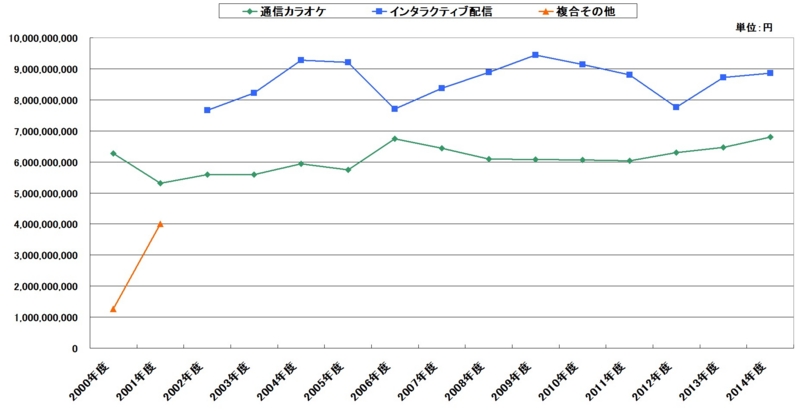
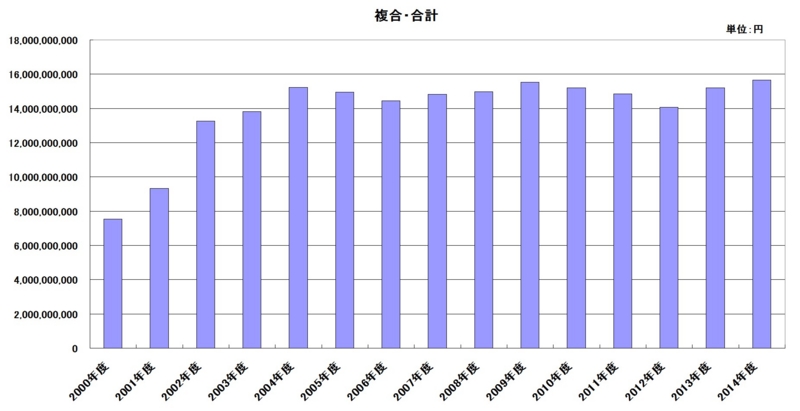
複合
|
通信カラオケ |
インタラクティブ配信 |
複合その他 |
| 2000年度 |
62億7303万8855円 |
* |
12億7250万3002円 |
| 2001年度 |
53億734万1027円 |
* |
40億861万6429円 |
| 2002年度 |
55億9265万428円 |
76億5746万752円 |
* |
| 2003年度 |
55億8917万6568円 |
82億1370万7656円 |
* |
| 2004年度 |
59億4464万2653円 |
92億7302万4051円 |
* |
| 2005年度 |
57億5094万193円 |
92億850万36円 |
* |
| 2006年度 |
67億3945万1239円 |
76億9924万5842円 |
* |
| 2007年度 |
64億3835万7018円 |
83億7398万875円 |
* |
| 2008年度 |
60億8628万2847円 |
88億9105万2016円 |
* |
| 2009年度 |
60億8139万4869円 |
94億4716万1779円 |
* |
| 2010年度 |
60億6283万4414円 |
91億4259万6802円 |
* |
| 2011年度 |
60億4260万8851円 |
88億1001万5986円 |
* |
| 2012年度 |
63億513万4642円 |
77億5735万7276円 |
* |
| 2013年度 |
64億7067万0163円 |
87億2136万79円 |
* |
| 2014年度 |
67億9915万6220円 |
88億6225万4890円 |
* |
|
複合・合計 |
| 2000年度 |
75億4554万1857円 |
| 2001年度 |
93億1595万7456円 |
| 2002年度 |
132億5011万1180円 |
| 2003年度 |
138億288万4224円 |
| 2004年度 |
152億1766万6704円 |
| 2005年度 |
149億5944万0229円 |
| 2006年度 |
144億3869万7081円 |
| 2007年度 |
148億1233万7893円 |
| 2008年度 |
149億7733万4863円 |
| 2009年度 |
155億2855万6648円 |
| 2010年度 |
152億543万1216円 |
| 2011年度 |
148億5262万4837円 |
| 2012年度 |
140億6249万1918円 |
| 2013年度 |
151億9203万242円 |
| 2014年度 |
156億6141万1110円 |
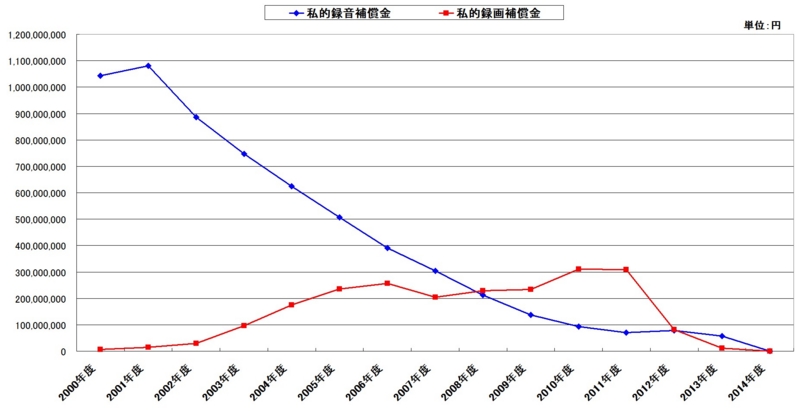
補償金
|
私的録音補償金 |
私的録画補償金 |
| 2000年度 |
10億4274万3638円 |
678万0311円 |
| 2001年度 |
10億8021万5243円 |
1481万3223円 |
| 2002年度 |
8億8624万2961円 |
2890万2722円 |
| 2003年度 |
7億4757万0777円 |
9667万2358円 |
| 2004年度 |
6億2459万3442円 |
1億7562万3815円 |
| 2005年度 |
5億0600万7278円 |
2億3609万7360円 |
| 2006年度 |
3億9041万7607円 |
2億5627万8441円 |
| 2007年度 |
3億0441万7559円 |
2億0459万5092円 |
| 2008年度 |
2億1231万5703円 |
2億2964万3762円 |
| 2009年度 |
1億3686万7520円 |
2億3311万4828円 |
| 2010年度 |
9339万1959円 |
3億1046万9622円 |
| 2011年度 |
6995万6731円 |
3億931万4463円 |
| 2012年度 |
7821万6798円 |
8254万5287円 |
| 2013年度 |
5670万8804円 |
1185万5400円 |
| 2014年度 |
156円 |
10万3244円 |
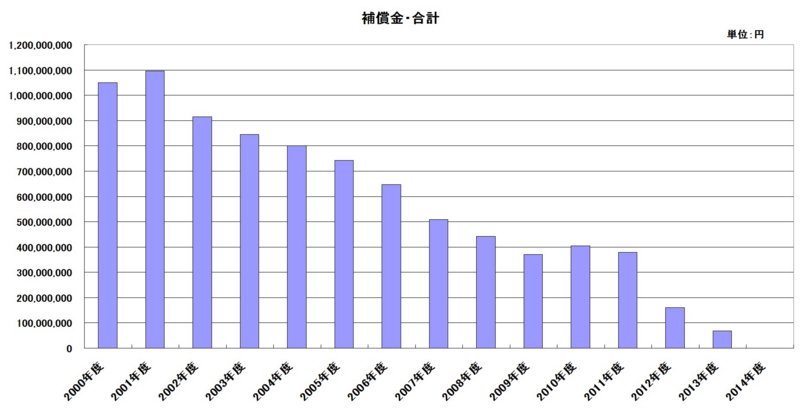
|
補償金・合計 |
| 2000年度 |
10億4952万3949円 |
| 2001年度 |
10億9502万8466円 |
| 2002年度 |
9億1514万5683円 |
| 2003年度 |
8億4424万3135円 |
| 2004年度 |
8億21万7257円 |
| 2005年度 |
7億4210万4638円 |
| 2006年度 |
6億4669万6048円 |
| 2007年度 |
5億901万2651円 |
| 2008年度 |
4億4195万9465円 |
| 2009年度 |
3億6998万2348円 |
| 2010年度 |
4億386万1581円 |
| 2011年度 |
3億7927万1194円 |
| 2012年度 |
1億6076万2085円 |
| 2013年度 |
6856万4204円 |
| 2014年度 |
10万3400円 |
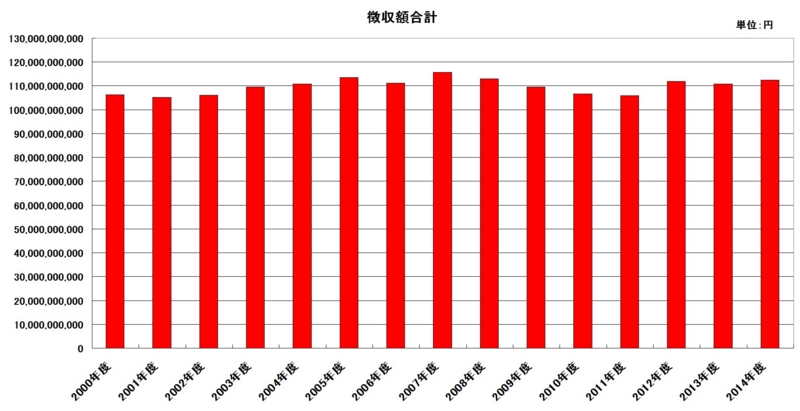
使用料徴収額合計
|
使用料徴収額合計 |
| 2000年度 |
1063億3141万8954円 |
| 2001年度 |
1052億8495万4607円 |
| 2002年度 |
1060億6753万6742円 |
| 2003年度 |
1094億7201万3648円 |
| 2004年度 |
1108億755万9857円 |
| 2005年度 |
1135億8957万0240円 |
| 2006年度 |
1110億9832万5339円 |
| 2007年度 |
1156億7055万6764円 |
| 2008年度 |
1129億4756万5919円 |
| 2009年度 |
1094億6429万7713円 |
| 2010年度 |
1065億6438万4941円 |
| 2011年度 |
1058億9387万2282円 |
| 2012年度 |
1118億4464万8192円 |
| 2013年度 |
1108億4558万4829円 |
| 2014年度 |
1124億9483万3336円 |
|
カテゴリ別の推移
|
演奏 |
録音 |
出版 |
貸与 |
複合 |
補償金 |
| 2000年度 |
378億6425万8725円 |
531億0314万4492円 |
26億7538万54円 |
40億9356万9877円 |
75億4554万1857円 |
10億4952万3949円 |
| 2001年度 |
404億9144万4736円 |
484億2198万3172円 |
19億9276万4147円 |
39億6777万6630円 |
93億1595万7456円 |
10億9502万8466円 |
| 2002年度 |
415億1650万7680円 |
448億2088万8916円 |
17億2567万3207円 |
38億3921万76円 |
132億5011万1180円 |
9億1514万5683円 |
| 2003年度 |
433億8301万146円 |
459億6606万9738円 |
17億4311万4516円 |
37億3269万1889円 |
138億0288万4224円 |
8億4424万3135円 |
| 2004年度 |
451億2223万8522円 |
442億3026万4483円 |
16億2729万5695円 |
38億0987万7196円 |
152億1766万6704円 |
8億0021万7257円 |
| 2005年度 |
483億5145万5176円 |
443億2577万7054円 |
15億4350万9004円 |
36億6728万4139円 |
149億5944万229円 |
7億4210万4638円 |
| 2006年度 |
487億7533万6869円 |
419億3102万8947円 |
15億42万8137円 |
38億613万8257円 |
144億3869万7081円 |
6億4669万6048円 |
| 2007年度 |
537億0327万1236円 |
414億6190万5306円 |
14億7917万7296円 |
37億485万2382円 |
148億1233万7893円 |
5億901万2651円 |
| 2008年度 |
520億0371万6670円 |
403億2300万3353円 |
15億4850万7692円 |
36億5304万3876円 |
149億7733万4863円 |
4億4195万9465円 |
| 2009年度 |
523億2815万2271円 |
362億8544万5888円 |
13億8822万3596円 |
35億6393万6962円 |
155億2855万6648円 |
3億6998万2348円 |
| 2010年度 |
517億739万8496円 |
342億9520万706円 |
13億1668万2649円 |
36億3581万0293円 |
152億0543万1216円 |
4億386万1581円 |
| 2011年度 |
516億1195万3207円 |
343億9154万3857円 |
11億8942万3588円 |
34億6905万5599円 |
148億5262万4837円 |
3億7927万1194円 |
| 2012年度 |
541億9762万5866円 |
393億3457万6484円 |
11億6307万5757円 |
29億2611万6082円 |
140億6249万1918円 |
1億6076万2085円 |
| 2013年度 |
553億2289万4082円 |
393億3457万6484円 |
11億6307万5757円 |
34億8397万3355円 |
151億9203万242円 |
6856万4204円 |
| 2014年度 |
590億6641万6738円 |
331億8638万2057円 |
11億4830万511円 |
34億3221万9520円 |
156億6141万1110円 |
10万3400円 |
<参考>「音楽ソフト生産実績」、「有料音楽配信売上」、「ライブ売上」との比較
※音楽ソフト*1生産金額は一般社団法人 日本レコード協会|各種統計|音楽ソフト種類別生産金額の推移より参照。
※有料音楽配信売上は一般社団法人 日本レコード協会|各種統計|有料音楽配信売上実績の2005年〜2014年の売上を参照。
※ライブの売上*2はhttp://www.acpc.or.jp/index.htmlの基礎調査推移表を参照。
※「音楽ソフト生産金額」、「有料音楽配信売上」、「ライブ売上」は年(1月〜12月)の数字。使用料徴収額は年度(4月〜翌3月)の数字になります。
|
音楽ソフト生産金額 |
有料音楽配信売上 |
ライブ売上 |
使用料徴収額合計 |
| 2000年度(2000年) |
5398億1600万円 |
* |
825億9200万円 |
1063億3141万8954円 |
| 2001年度(2001年) |
5030億6100万円 |
* |
776億5000万円 |
1052億8495万4607円 |
| 2002年度(2002年) |
4814億5400万円 |
* |
814億8900万円 |
1060億6753万6742円 |
| 2003年度(2003年) |
4561億7900万円 |
* |
942億8200万円 |
1094億7201万3648円 |
| 2004年度(2004年) |
4312億6900万円 |
* |
900億9200万円 |
1108億755万9857円 |
| 2005年度(2005年) |
4222億1000万円 |
342億8300万円 |
1049億2700万円 |
1135億8957万240円 |
| 2006年度(2006年) |
4084億800万円 |
534億7800万円 |
924億7500万円 |
1110億9832万5339円 |
| 2007年度(2007年) |
3911億1300万円 |
754億8700万円 |
1040億6400万円 |
1156億7055万6764円 |
| 2008年度(2008年) |
3617億7500万円 |
905億4700万円 |
1074億9500万円 |
1129億4756万5919円 |
| 2009年度(2009年) |
3165億1500万円 |
909億8200万円 |
1255億400万円 |
1094億6429万7713円 |
| 2010年度(2010年) |
2836億1200万円 |
859億9000万円 |
1280億3900万円 |
1065億6438万4941円 |
| 2011年度(2011年) |
2818億5000万円 |
719億6100万円 |
1596億2000万円 |
1058億9387万2282円 |
| 2012年度(2012年) |
3108億2800万円 |
542億9800万円 |
1701億4400万円 |
1118億4464万8192円 |
| 2013年度(2013年) |
2704億6800万円 |
416億6100万円 |
2318億3200万円 |
1108億4558万4829円 |
| 2014年度(2014年) |
2541億7600万円 |
436億9900万円 |
2749億4400万円 |
1124億9483万3336円 |
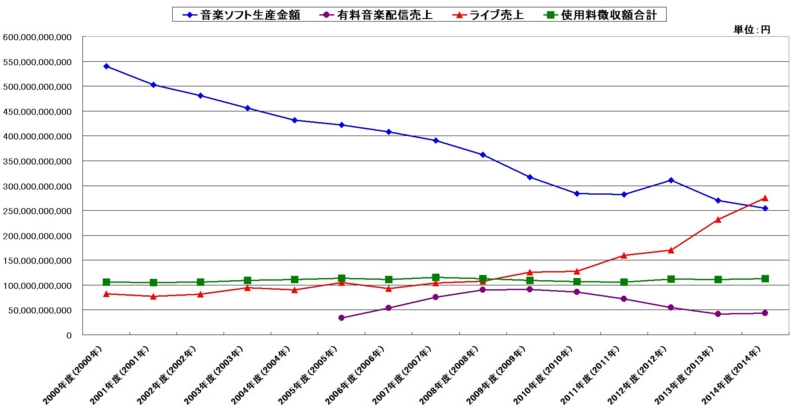
JASRACの使用料徴収額の合計は2000年度〜2014年度までほとんど変化はありません。しかし、中身は変わってきており、CDの売上減少に伴い「オーディオディスク」からの徴収額が減少。対して「放送」からの徴収額が増加してきています。それと、近年のライブ市場の好調もあってか「演奏等」からの徴収額が回復傾向にあります。
様々な評価があるJASRACですが音楽市場が変化していく中で使用料徴収額を維持しているのは、いろいろな意味で有能な組織なんだろうと思います。


